For 1 to 1000+ clinics, connect with more than 100 reports fully integrated into all aspects of your everyday operations. Track, monitor, and manage with live financial insights that help you step up your decision-making process with real-time accuracy.
Tools That Work for You
Access reporting and key performance indicators with real-time data.
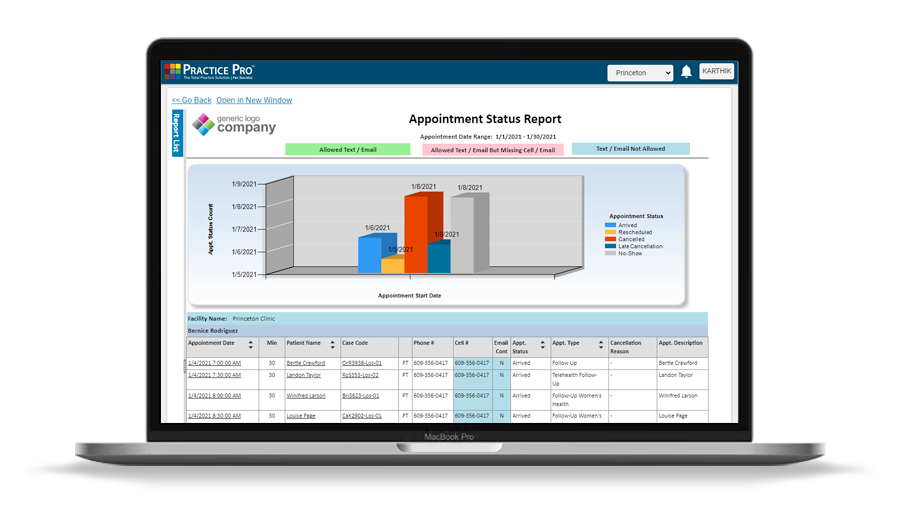
Customized Reporting
Access the reports you need quickly on a dashboard prioritized by you that provides insight into the care you provide and the overall health of your business.
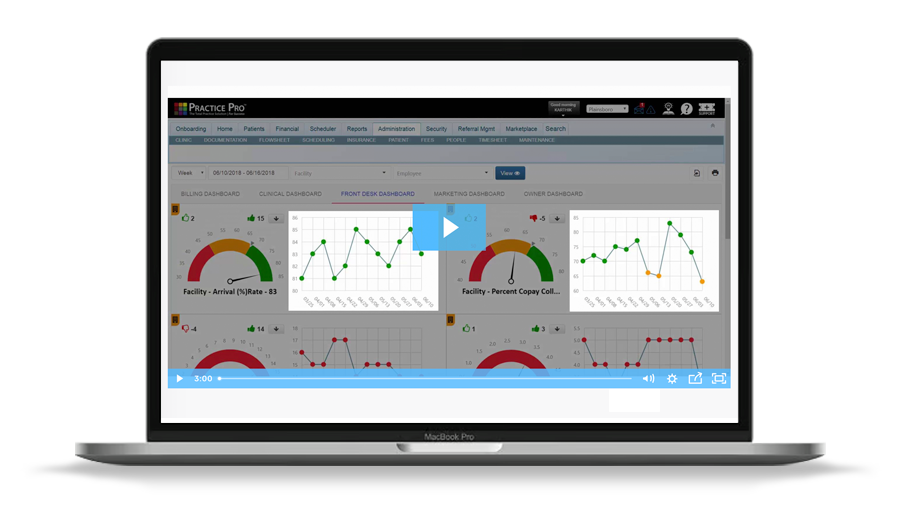
Set Goals and Monitor Performance
Track your progress across a variety of key performance indicators (KPI). Color-coded charts show whether you are meeting goals and how your performance trends.
Secure Role-Based Access
Easily manage privileges to reports and other sensitive information based on role,location, and region.
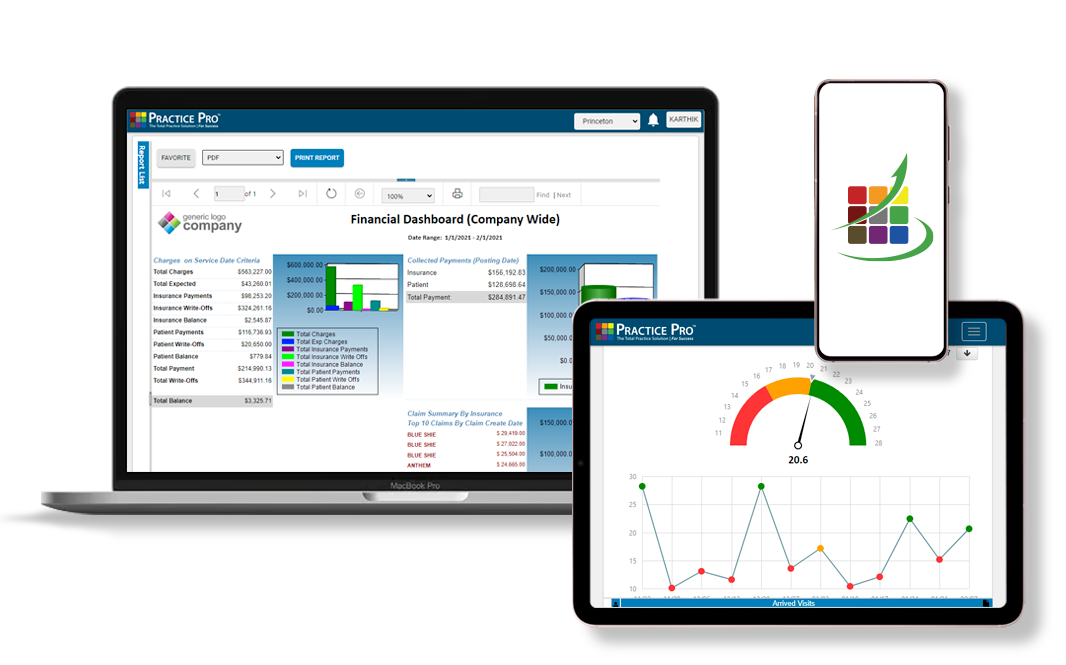
Power up operational reporting tools that help to optimize resources, reduce costs, and enhance efficiencies.
Access data connected to the heartbeat of your business—all in one view with reporting backed by 20+ years of experience.
Track, monitor, and manage with live insights that help you step up the decision-making process with real-time accuracy.
KPI | Key Performance Indicators
Better care means reporting that helps you measure, manage and grow.
Analytics reporting all in one place helps you focus on the key performance indicators that matter most.
Critical metrics converge in multiple dashboards across departments, and they are flexible and customizable based on the structure of your practice.
A clean and easy-to-navigate design facilitates setting goals and monitoring trends.
Individualized performance tracking allows you to see, at a glance, the progress of your therapists and clinics and helps you better plan for the results you want to achieve.
From strategic data and insights to information assimilation across different regions, hundreds of therapists, specialties, and key performance indicators, our ABI module gives you enterprise-grade technology to monitor productivity, outcomes, billing revenue, and even retail sales, all in one place— no matter the size of your organization.